

Fair Value Gap (FVG): How to Trade the Imbalance
The fair value gap (FVG) marks where price moved too fast. Learn to spot, validate and trade FVG imbalance zones. Read the full guide.
Chart Analysis Tools
Quantitative indicators and visual chart aids designed to uncover high-probability market structure, liquidity pools, and momentum divergences. Rather than generating noisy lagging signals, the indicators collected here emphasize non-repainting price action, multi-timeframe confluence, and institutional order flow levels to sharpen your manual execution and algorithmic triggers.
The fair value gap (FVG) marks where price moved too fast. Learn to spot, validate and trade FVG imbalance zones. Read the full guide.
Volatility measures how far price swings, not where it goes. Learn ATR, VIX, Bollinger Bands and risk rules for wild markets. Read the full guide.

Dual-panel trend and oscillator confirmation system with clear Long, Short, and Close labels.
View Details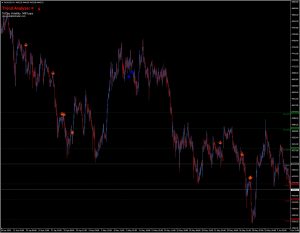
4-step systematic trend filtering with pivot support/resistance and ATR volatility-based stops.
View Details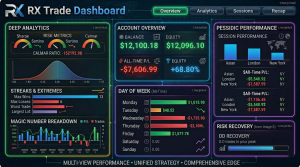
The Ultimate MT5 Account Analysis Toolkit
View Details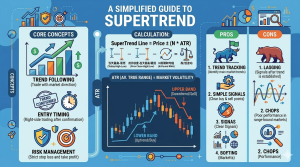
Adaptive ATR-based volatility bands tracking directional trend flips and trailing stop levels.
View Details| Tool Type | Analytical Focus | Timeframe Confluence | Primary Signal |
|---|---|---|---|
| Structure Locator | Swing High/Low, Break of Structure (BOS) | H4 structure + M15 entry | Trend Continuation |
| Liquidity Map | Fair Value Gaps, Equal Highs/Lows | H1 zones + M5 entry | Target & Invalidation |
| Divergence Oscillator | Price vs Volume/RSI divergence | M15, H1 | Exhaustion & Reversal |
Indicators can act as macro regime filters. For example, restricting a trend-following EA to take trades only when a multi-timeframe indicator confirms higher-timeframe alignment substantially reduces false breakout losses.