Third-party product
Trend-Following Indicator Based on ATR
No official listing has been supplied for this product.
Source information only
Product details are sourced from the publisher. RBOT.CC has not independently verified performance claims.
This page describes a third-party product. RBOT.CC is not the developer unless explicitly stated. Verify all claims before use.
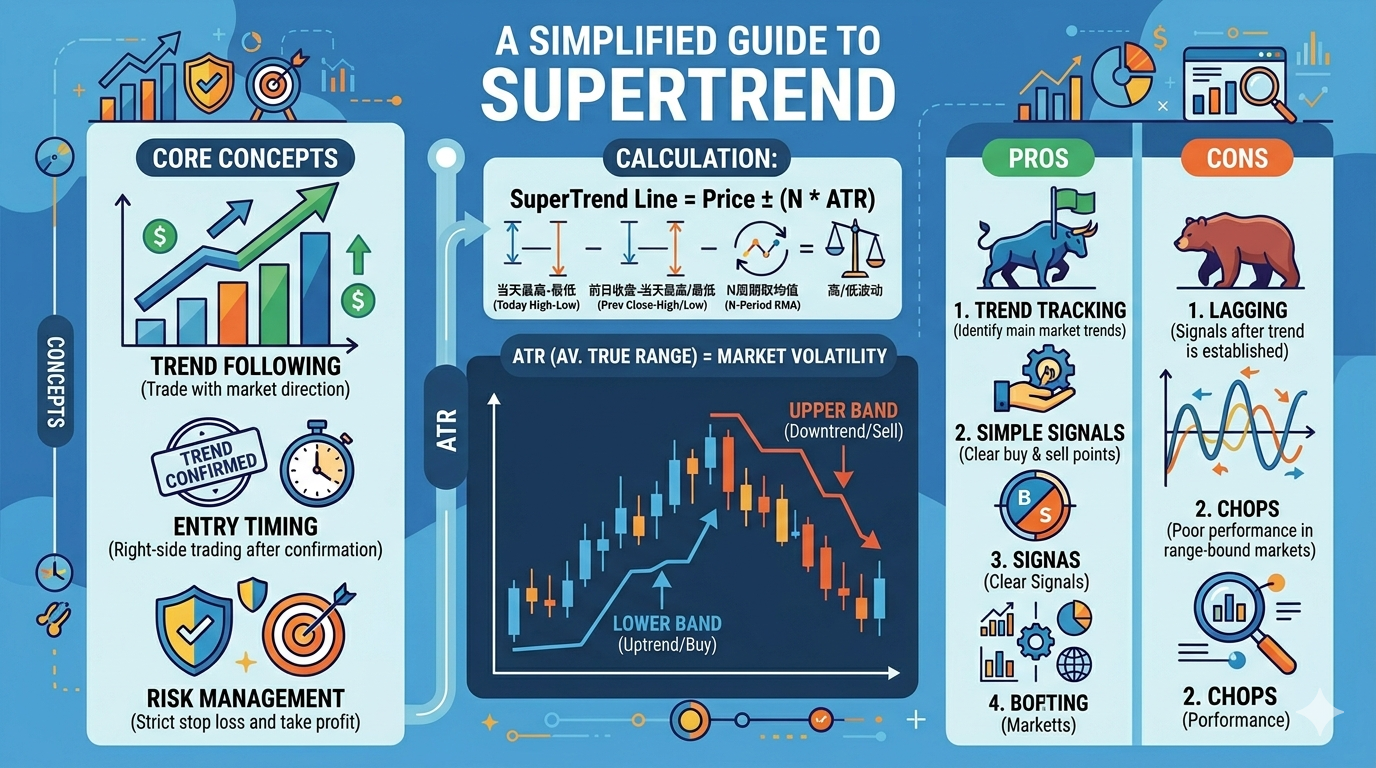
SuperTrend calculates the Average True Range over a configurable period (typically 10-14 candles), then plots an upper band (price + N×ATR) and lower band (price - N×ATR). When price closes above the upper band, the trend flips bullish (green line). When price closes below the lower band, the trend turns bearish (red line). This is classic trend-following: enter after confirmation, not before.
SuperTrend naturally adapts to market volatility—when ATR rises, the bands widen, reducing false breakouts during volatile periods. The indicator works well with tight stops placed beyond the band. Combine with position sizing rules and a maximum risk-per-trade cap to stay disciplined across extended drawdown periods.
Works on all currency pairs, indices, commodities, and crypto. Best on H1, H4, and Daily timeframes. Avoid using on very low timeframes (M1-M5) during low-volatility sessions.
⚠ READ BEFORE USE
This EA is for educational and expert use only. Test on a DEMO account for at least 30 days before going live. By clicking “OK”, you acknowledge and accept the risks of trading.