

A red Monday on the S&P 500 can look like a buying opportunity. But buying every dip leaves three questions unanswered: how much weakness qualifies, when do you enter, and when do you get out if the rebound never comes?
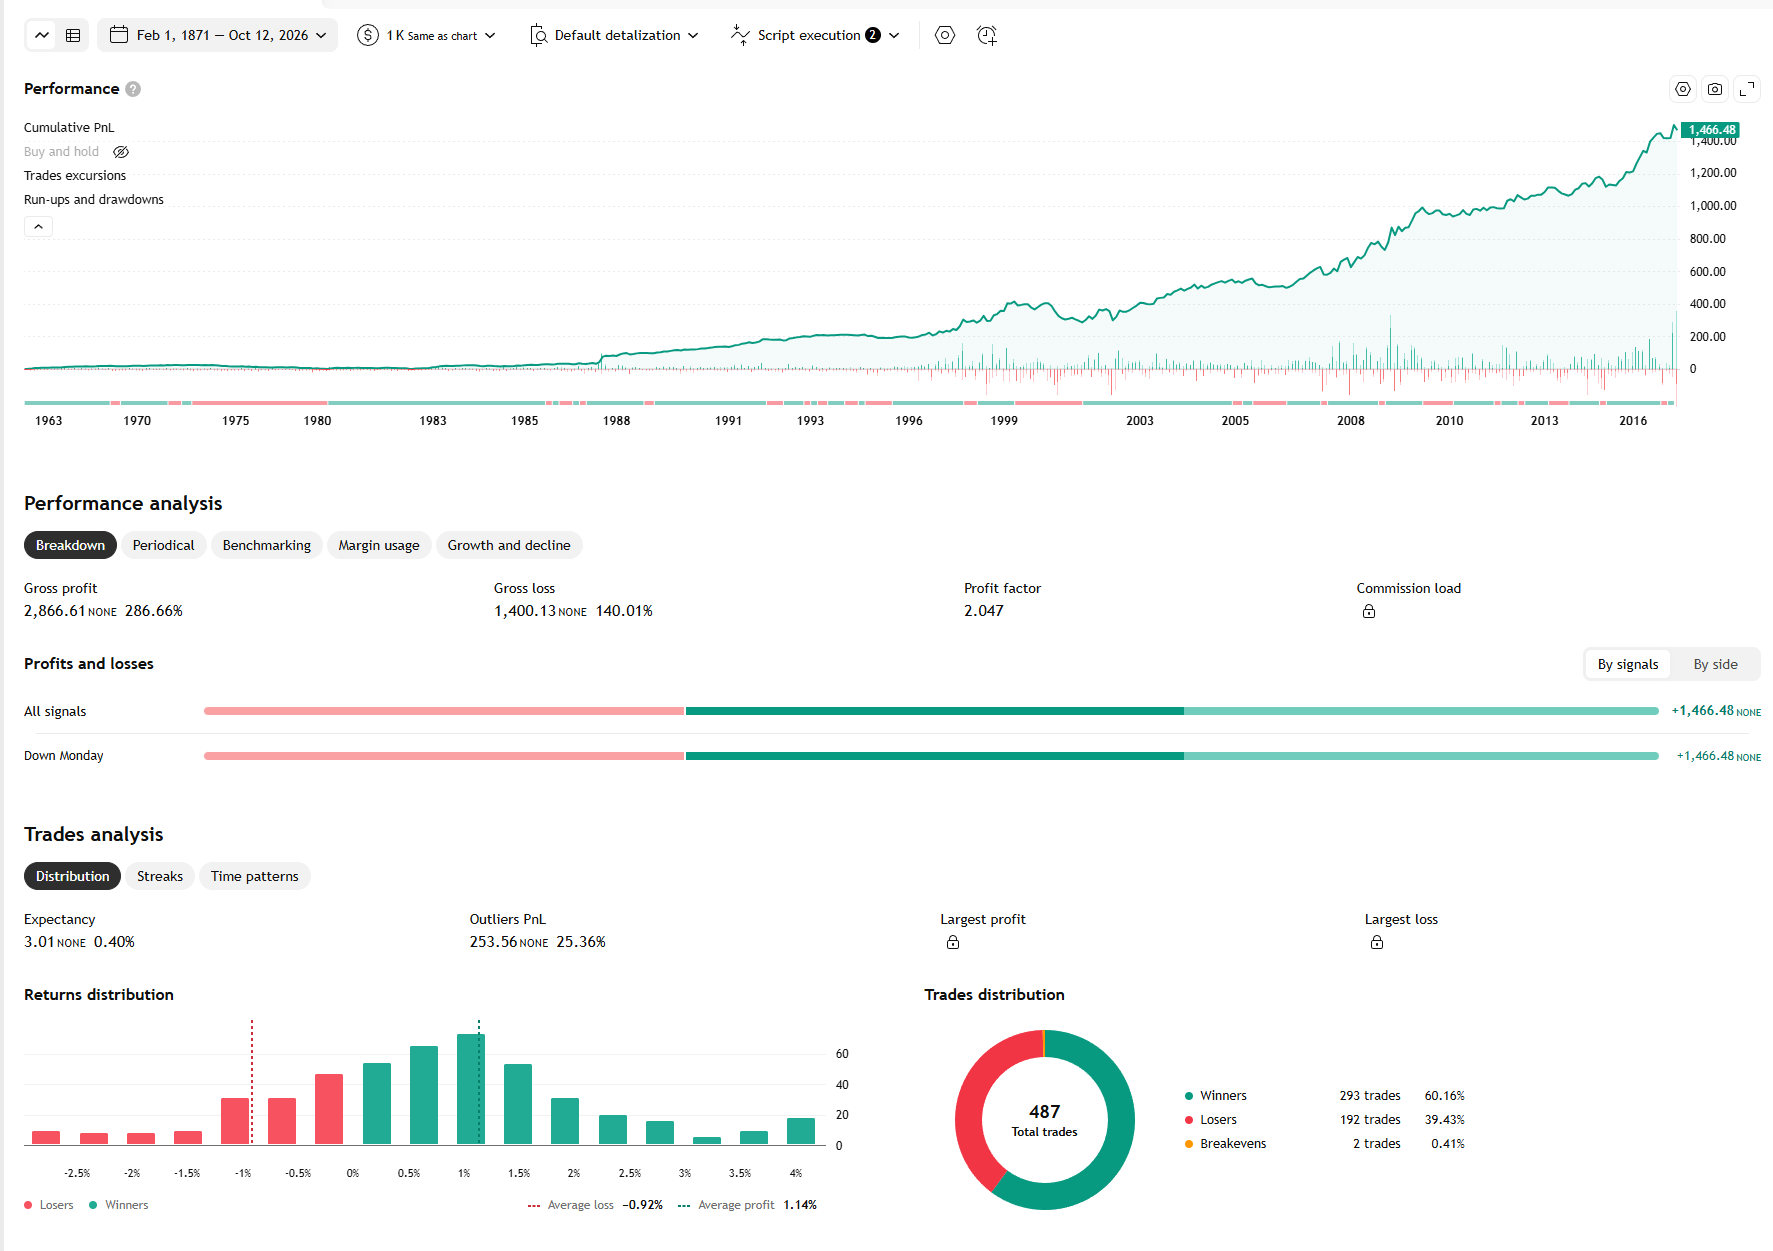
Monday Dip turns that idea into a set of daily rules you can test. In my TradingView backtest, the report recorded 487 trades, a 60.16% win rate and a profit factor of 2.047. Below, I explain the rules in the downloadable Pine version, what those results mean, and how to run your own test.
Turn “buy the dip” into a specific entry
The strategy only considers a long entry when Monday closes below the previous trading-day close and there is no open strategy position. It waits for the daily candle to finish, so a drop at lunchtime is not enough to trigger an entry.
By default, a second filter checks where Monday closed within its own range. This is called Internal Bar Strength, or IBS:
IBS = (close − low) / (high − low)
The default threshold is 0.25. For example, if Monday’s low is 5,000 and its high is 5,100, a close at 5,020 gives an IBS of 0.20 and passes this filter. A close at 5,060 gives 0.60 and fails. The filter selects Mondays that finish near the bottom of their range; it does not predict that Tuesday must rise.
An optional 180-day moving-average filter is also available. When enabled, Monday must close below that average. It is off by default, so you can compare results with and without it.
Know the exit before entering
With the supplied execution settings, a qualifying Monday generates an entry request after the close, normally filled at the next trading day’s open. On a normal trading week, that means Tuesday morning.
The strategy then requests a market exit after Wednesday’s close, normally filled at Thursday’s open. If Wednesday’s bar is missing, a later trading day can trigger the exit. A price stop can close the trade earlier.
This gives you a concrete holding window to test instead of waiting indefinitely for a recovery. There is no take-profit order. The default stop sits 10% below the filled entry price. That is a price distance, not a promise to risk only 10% of your account; position size determines how much money is exposed.
What the 487-trade backtest tells us
| Measure | Result | How to read it |
|---|---|---|
| Total trades | 487 | 293 winners, 192 losers and 2 breakeven trades |
| Win rate | 60.16% | About six in ten trades finished profitable |
| Profit factor | 2.047 | Total gains were about twice total losses |
| Average winning trade | +1.14% | Average percentage gain among winning trades |
| Average losing trade | −0.92% | Average percentage loss among losing trades |
| Average trade return | +0.40% | The report’s average percentage return per trade |
The useful point is the combination of win rate and payoff. In this run, winning trades were more frequent, and their average percentage gain was larger than the average losing trade’s percentage loss. A high win rate alone would be less encouraging if occasional losses overwhelmed those gains.
There were still 192 losing trades. Buying a weak Monday does not remove the possibility of further declines, and the upward cumulative curve includes setbacks and periods with little progress. This result gives us a reason to investigate the rules further, rather than a reason to assume the next trade will win.
Test the idea on your own chart
Download the free Monday Dip Pine Script source. Open a standard 1D chart in TradingView, paste the .pine file into Pine Editor, save it and add it to the chart. No paid TradingView script-publication feature is needed to download the file from this website.
Start by checking a few trades: Monday’s signal, the next session’s entry, and the scheduled exit or stop. Then set realistic commission, slippage and position size. The supplied script defaults to zero commission and slippage, so leaving those unchanged does not test the costs you would actually pay.
Compare the IBS filter on and off, and examine recent years separately from older periods. If you plan to trade an ETF, futures contract or CFD, test that instrument’s data and specifications rather than assuming the SPX chart result transfers unchanged. Keep a record of each parameter set so you can tell which changes helped and which merely fitted the past.
What you get from this strategy
You get an explicit definition of a Monday dip, a filter you can adjust, a scheduled exit, a protective stop and the source code to inspect. That makes the idea easier to test and compare with your own approach. It does not provide a live trading recommendation or a guaranteed return.
Test note: The figures above come from my TradingView screenshot. The downloadable version has not been independently rerun to reproduce those figures. The screenshot does not show maximum drawdown or actual first and last trade dates, so those are not reported here. Historical results do not guarantee future performance.
Further reading: TradingView’s profit factor definition and strategy execution and backtesting documentation.
About the author — RBot
Quantitative Developer | EA & Algorithmic Trading Specialist
Specializing in high-performance MT4/MT5 Expert Advisors, technical indicators, and quantitative trading tools.
📊 Focus: Robust risk management, Machine Learning models, and automated execution.


123