

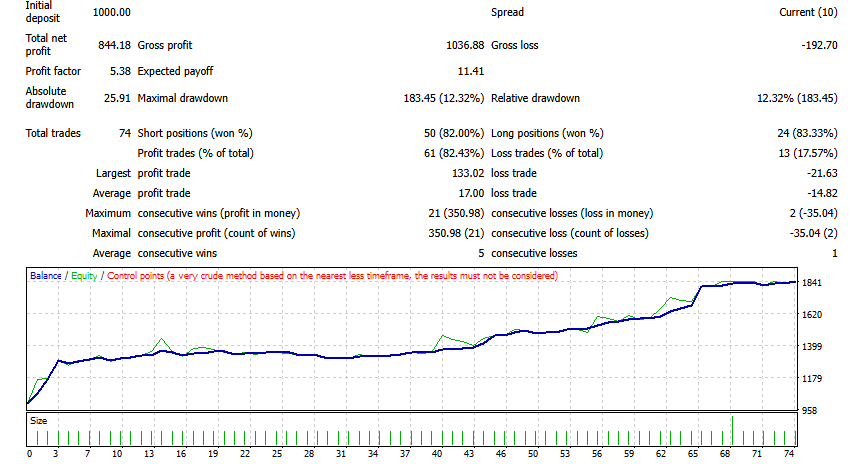
The backtest looks great. The demo account makes money. Then you go live—and the EA starts losing. What changed? The screenshots supplied for this article show a backtest net profit of 844.18 on an initial deposit of 1,000.00, a demo net profit of 1,456.96, and a live-labelled net loss of 646.00.
Those screenshots alone do not establish that the same EA, version, settings, or period produced all three results, and they do not say what caused the difference. What follows is the three-stage vetting process I use: backtest, demo, then live.
What the Three Reports Show
Read directly off the screenshots — screenshot facts, not recalculated results. Currency unspecified; demo and live labels follow the owner’s filenames, not independently authenticated.
| Metric | Backtest (Strategy Tester) | Demo (owner-labeled) | Live (owner-labeled) |
|---|---|---|---|
| Net profit | 844.18 | 1,456.96 | −646.00 |
| Profit factor | 5.38 | 1.70 | 0.83 |
| Total trades | 74 | 331 | 225 |
| Drawdown (as shown) | 12.32% (relative/maximal) | 31.78% | 18.42% |
| Initial deposit | 1,000.00 | Not verified here | Not verified here |
Different samples, unknown periods and settings, no spread or slippage evidence — the records cannot be compared one-to-one.
Reading the Backtest Screenshot Honestly
The backtest screenshot shows net profit of 844.18 on an initial deposit of 1,000.00, a profit factor of 5.38, 74 total trades, relative/maximal drawdown of 12.32%, and spread Current (10).
The red label on the report matters more than the numbers: “Control points (a very crude method based on nearest less timeframe, results must not be considered).” MetaTrader itself says these results must not be considered, so they are an insufficient basis for evaluating live suitability. A suitable higher-quality retest is needed before judging the EA.
The screenshot also omits the full date range, symbol, settings, and lot-size history — nobody can reproduce the result or check whether the strategy quietly increased position sizes.
Check the Original Report Before Judging a Screenshot
A screenshot is a picture of a report; the report is the record. Our Data Lab accepts the original MT4/MT5 HTML backtest or statement report, parses it into structured metrics, and runs an AI assessment that flags questions worth asking — whether position sizes grow as losses accumulate, for example.
Two boundaries matter. First, the AI assessment generates inferences; the HTML report is the record — treat every AI observation as a question to verify against the original evidence, not a verdict. Second, the screenshots here are PNGs, which that workflow does not accept; they were not uploaded or parsed there, and this article is not a review by that tool.
Disclosure: the Data Lab is operated by the same team behind this site — a review aid, not an independent certification. For testing mechanics, MetaTrader’s official testing documentation is the authoritative reference.
Stage 2: What the Demo Test Adds
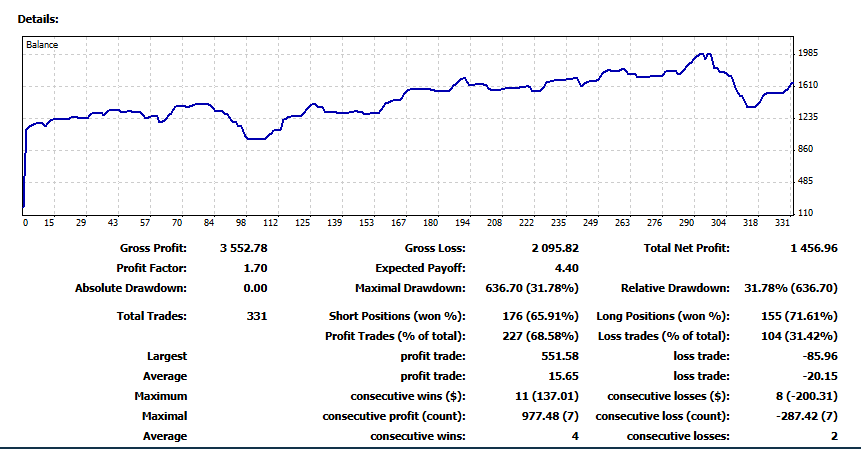
A demo account removes one variable — your money — and exposes others. The demo screenshot shows net profit of 1,456.96, profit factor 1.70, 331 trades, drawdown 31.78%, on a record labeled “demo test” by the owner’s filename.
The demo stage is for comparison: same trade frequency? similar holding times? a drawdown profile resembling the test? A demo profit factor of 1.70 after a backtest of 5.38 is not automatically a red flag — the samples differ — but that gap is what a careful demo run should investigate.
In my own experience as an EA user, demo spreads have sometimes been more stable than live spreads on the same broker — a personal observation, not a measurement — so a demo run can flatter a spread-sensitive strategy. Record the spread your demo quotes during the hours your EA actually trades.
Stage 3: The Small Live Test
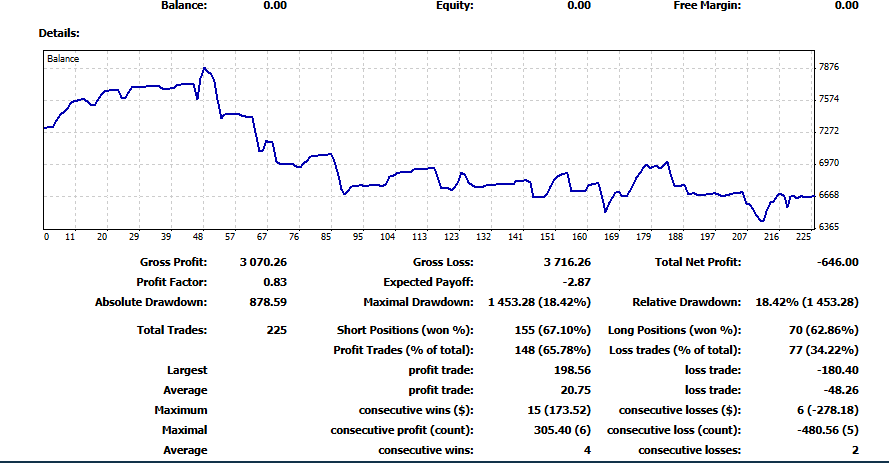
Only after backtest and demo agree within reason should real money enter, in the smallest viable amount. The live screenshot shows a net loss of 646.00, profit factor 0.83, 225 trades, drawdown 18.42%, on a record labeled by the owner’s filename.
The caveats apply with extra force: the label is a filename, not verification; the sample differs; period and settings are unknown; no spread or slippage data accompanies the image. The top shows balance, equity, and free margin of 0 — zeros alone do not establish the cause; the full statement history is needed for that.
Spreads Decide Whether Scalping Survives
Small profit targets leave little room for extra trading costs. If matched measurements show live spreads are consistently wider or more volatile during the EA’s trading hours, I avoid scalping EAs.
A longer-target or longer-term EA can be considered instead if it has been stable across backtest, demo, and small live tests. Spread is a smaller fraction of the move being captured — but risks change shape rather than disappear: longer holds accumulate swap, and weekend or news gaps can jump straight past a stop.
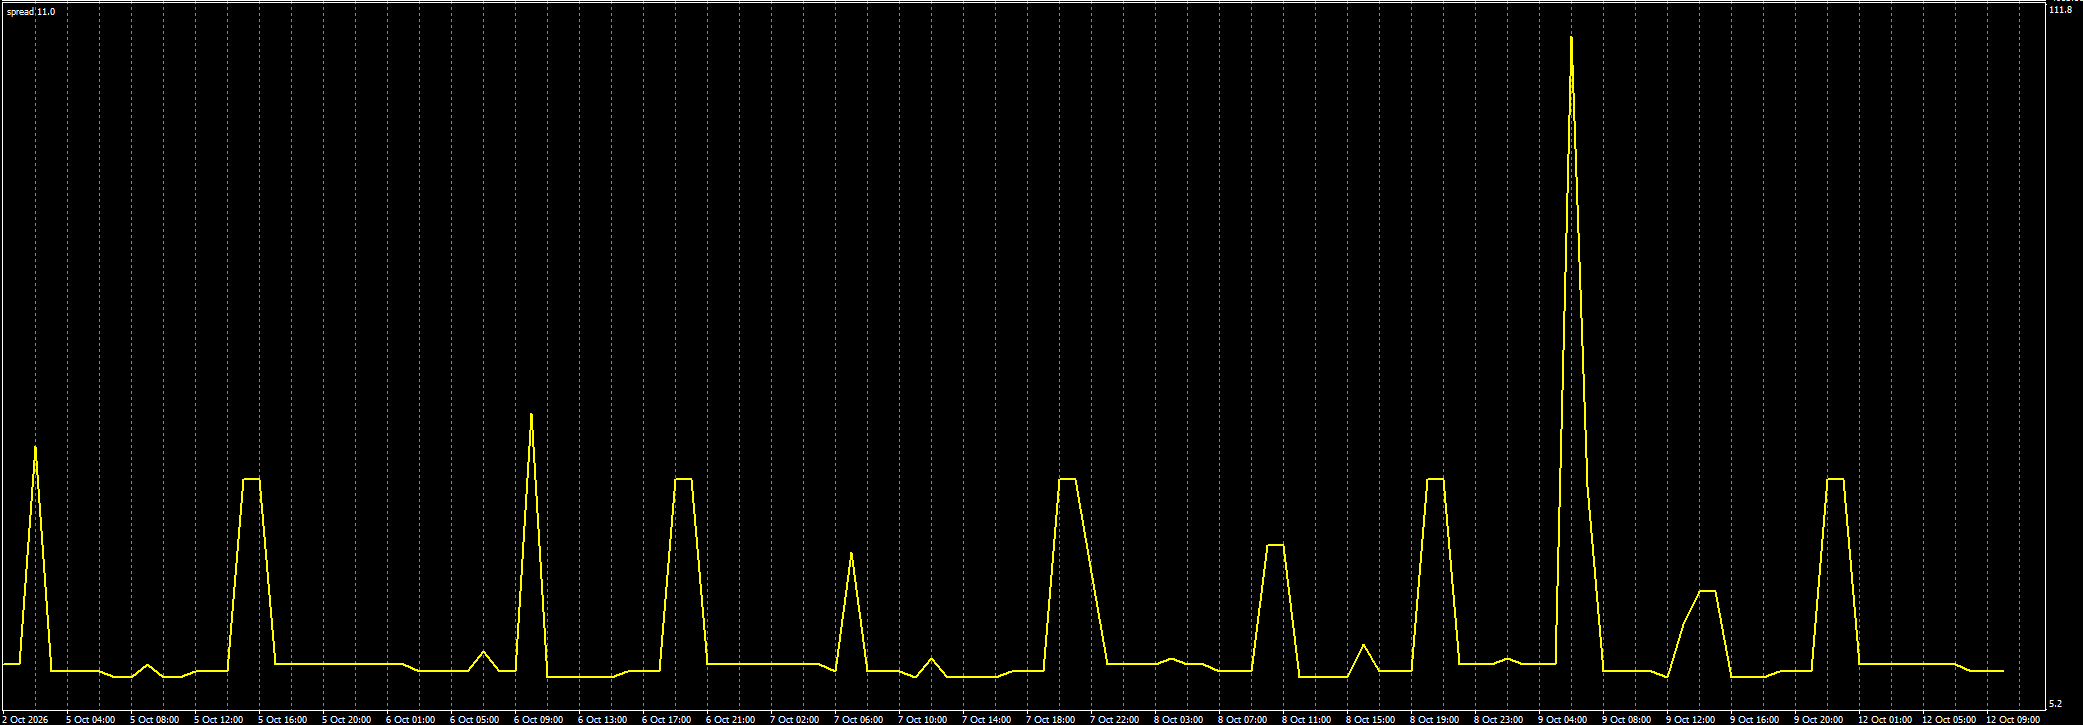
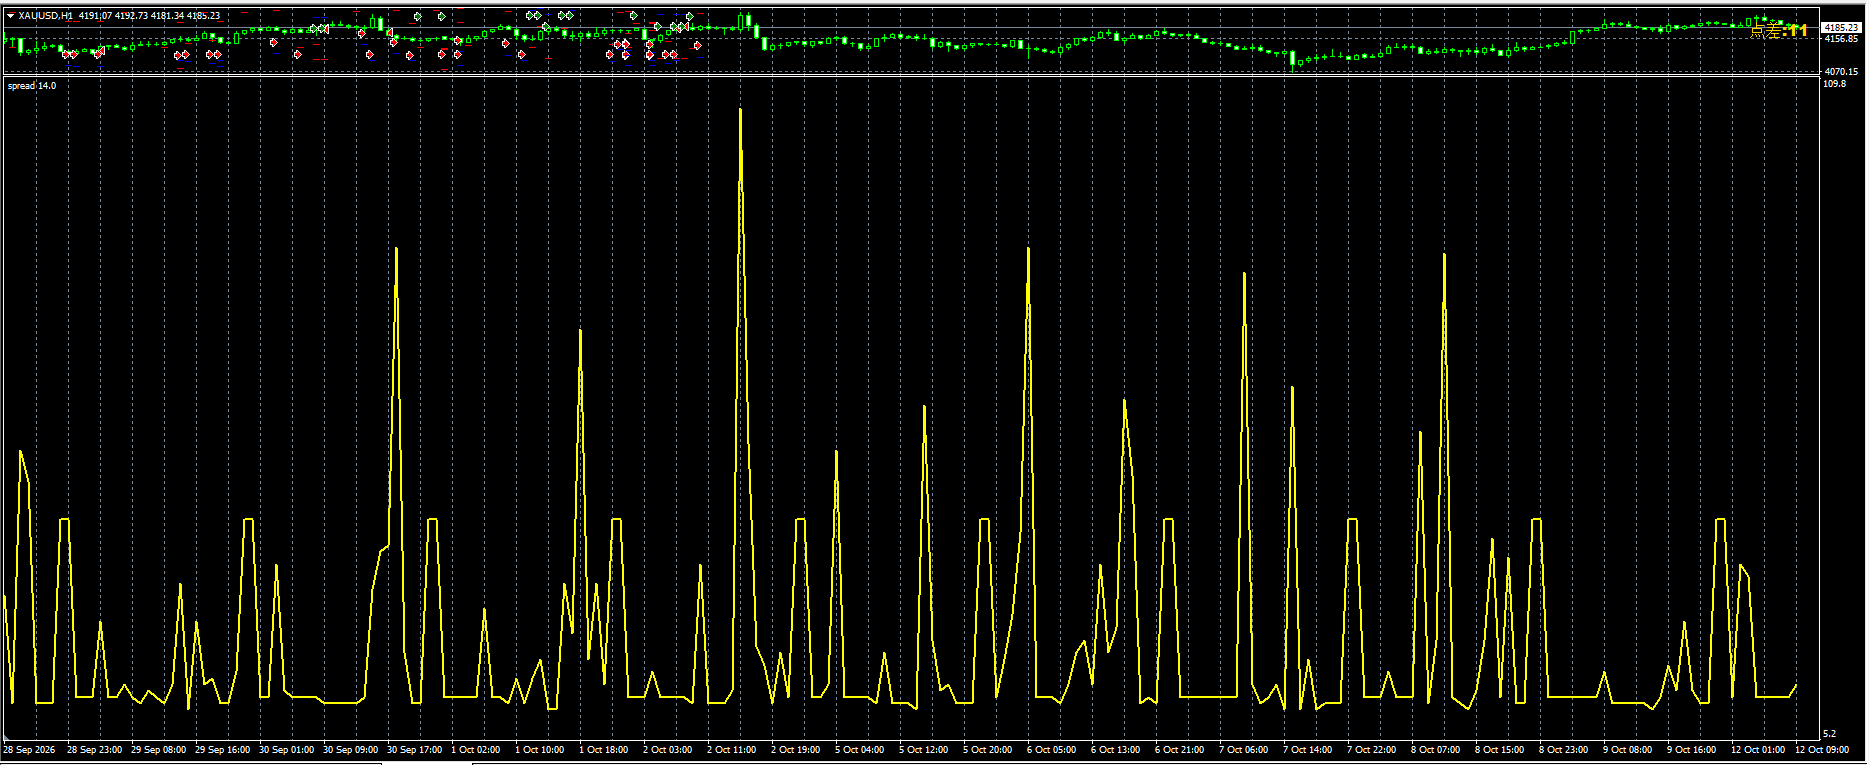
The two spread charts below use the account labels confirmed by the owner: the demo chart covers approximately October 2–12, 2026, and the live chart covers approximately September 28–October 12, 2026. The demo trace spends longer near its lower level, with occasional spikes; the live trace shows more frequent irregular spikes. Open the full images to inspect the right-hand scales.
| Spread indicator reading | Demo chart | Live chart |
|---|---|---|
| Axis bounds (display range) | 5.2–111.8 | 5.2–109.8 |
| Current spread label (snapshot) | 11.0 | 14.0 |
The similar right-axis ranges help put the traces in context: a larger displayed upper limit alone is not evidence of worse trading conditions. The visible difference is the pattern of spread fluctuations. These screenshots illustrate the owner’s observation that live spreads can fluctuate more than demo spreads. They do not provide matched spread statistics or prove that spread caused the reported live loss. Compare the same symbol and overlapping trading hours with timestamped records before making that causal claim. No points-to-pips conversion is assumed.
Why I Avoid Grid and Martingale EAs
I avoid martingale EAs. A martingale scheme increases exposure as losses accumulate — typically enlarging size after each loss so one winner recovers everything. Large capital is put at risk for small gains, and a single severe adverse move can wipe out every gain accumulated.
I avoid grid EAs too. A grid is distinct: orders at predetermined price intervals, without necessarily increasing size after losses. Grids can also build heavy floating exposure in a strong trend — a different mechanism, but the same reason for caution; judge them separately.
One nuance: adding to losing positions does not by itself establish martingale. A strategy might scale into a planned position under fixed caps, or add on fresh signals. The questions that matter: did size grow as a function of losses, and was there a hard limit? Answering them requires trade history and lot sizes, not a net-profit summary.
That is why equity versus balance matters. Balance reflects realized results and account cash flows; equity also includes floating profit or loss on open positions. A recovery or grid system can show a healthy balance for months while equity quietly deteriorates — and margin checks use equity. Watch equity.
A Three-Stage Checklist
Stage 1 — Backtest
- Rerun with a suitable higher-quality modelling option; a “control points” result is an insufficient basis.
- Include realistic spread, commission, and swap.
- Confirm the report shows full dates, symbol, settings, and lot history.
- Judge drawdown alongside profit.
Stage 2 — Demo
- Run the same EA, symbol, timeframe, and settings as the backtest.
- Record spreads during the EA’s actual trading hours.
- Compare frequency, holding time, and drawdown against the test.
Stage 3 — Live, small
- Start with the smallest viable size.
- Compare fills and spreads against the demo run.
- Monitor equity, not just balance.
- Define stop conditions in advance.
Frequently Asked Questions
Does a profitable backtest guarantee live profits?
No. A backtest is a simulation whose quality depends on modelling, spread, and cost assumptions. Here, the live-labeled record lost while the test gained.
My EA adds to losing positions. Is it a martingale?
Not necessarily. Martingale is a rule where exposure grows as a function of losses, often doubling. If lot sizes multiply after losses without a cap, treat it as martingale-like.
Is grid trading the same as martingale?
No. A grid places orders at fixed price intervals; size may stay constant. Both can accumulate large floating exposure, but they are distinct.
Sources
- MetaTrader 5 Help — Algotrading: Testing (official Strategy Tester documentation).
- RBOT Data Lab (parsing and AI-assisted review of original MT4/MT5 HTML reports; operated by this site’s team — see disclosure above).
Before You Risk Money
- Backtest: what happens when it loses?
- Demo: does it follow the rules in real time?
- Small live test: what changes under actual execution?
That’s the checklist I use before increasing exposure. To review your original MT4/MT5 report — with parsed metrics and AI-flagged questions you can verify against the original file — upload it to the Data Lab.
Which part would you like me to demonstrate next: spotting increasing exposure, or comparing demo and live trades?
This article is educational, not financial advice. Trading leveraged products carries a high level of risk, including total loss. The screenshots are owner-supplied historical records — illustrations, not recommendations — and past performance does not guarantee future results.