In the complex world of financial trading, having reliable tools to identify market trends is crucial. One such tool that has gained significant popularity among traders is the BDFX indicator. This article will delve into what makes the BDFX indicator a highly useful trend – following tool.
How BDFX Works
The BDFX indicator is designed to analyze price movements in the market. It uses a combination of algorithms that take into account various factors such as price highs, lows, and closing prices over different time periods. By processing this data, the indicator can effectively determine the direction and strength of the current market trend.
For example, it might calculate moving averages of prices over short – term and long – term intervals. If the short – term moving average is above the long – term moving average, it could be a sign of an uptrend. The BDFX indicator then visually represents this information on a trading chart, making it easy for traders to interpret.
Visual Representation and Signals
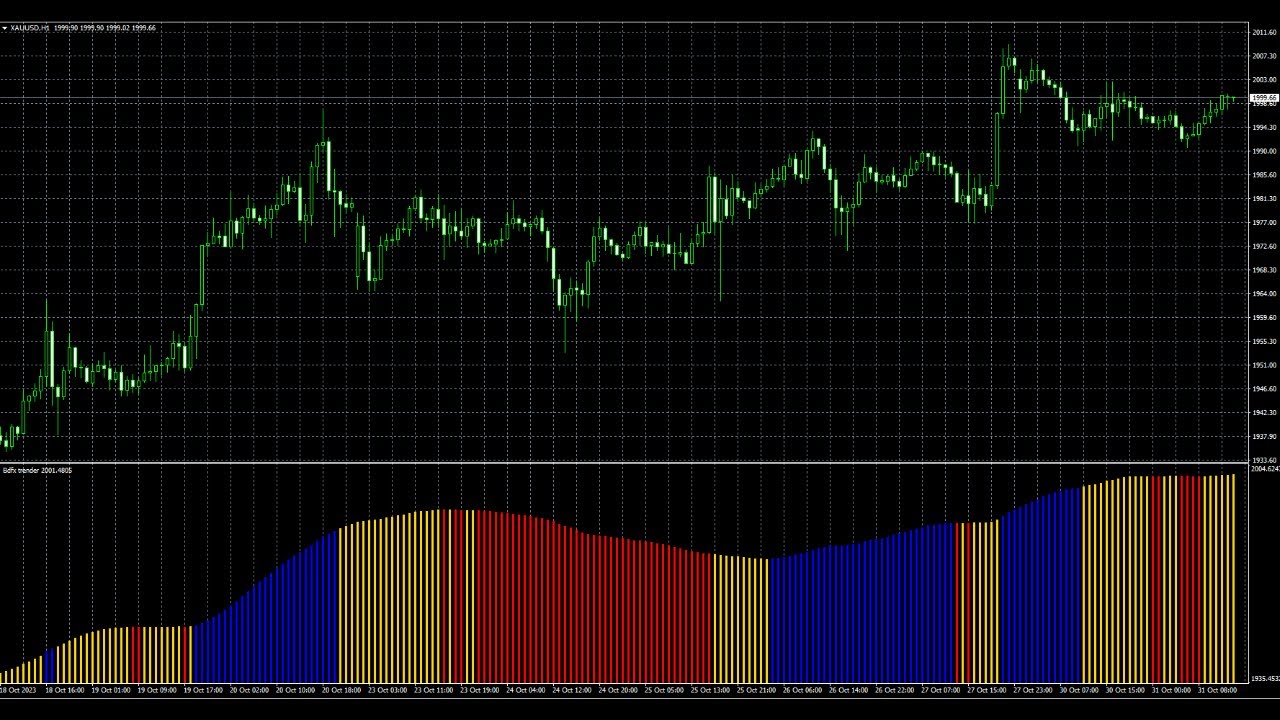
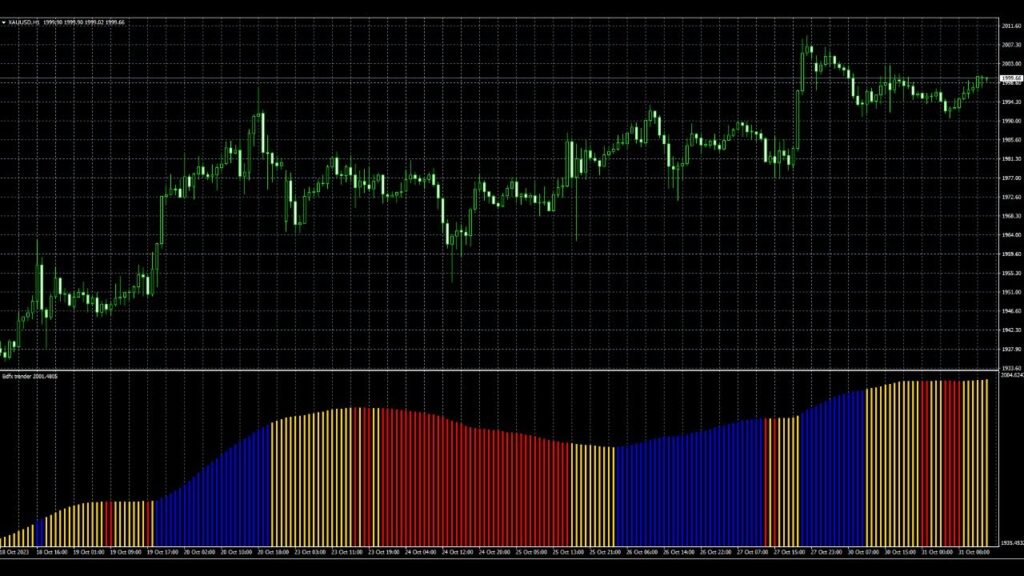
One of the most appealing aspects of the BDFX indicator is its visual simplicity. It typically uses different colors to denote different market conditions. For instance, blue bars might indicate an upward – trending market. When a trader sees a series of blue bars on the chart, it signals that the price is likely to continue moving up in the short to medium term.
Conversely, red bars are used to represent a downward – trending market. If the chart shows consecutive red bars, it suggests that the price is in a downtrend, and selling positions might be more favorable.
In addition, yellow bars are often used to indicate a flat or range – bound market. During such periods, the price is moving within a relatively narrow range, and trading opportunities might be less clear – cut. Traders may choose to be more cautious or look for other signals when the BDFX indicator shows yellow bars.
Customization and Adaptability
The BDFX indicator is highly customizable, which makes it suitable for a wide range of trading styles and preferences. Traders can adjust parameters such as the time frames used in the calculations. Short – term traders might focus on 1 – minute or 5 – minute time frames to capture quick price movements, while long – term investors could use daily or weekly time frames to identify major trends.
Furthermore, traders can customize the sensitivity of the indicator. A more sensitive setting will pick up on even minor changes in the trend, which can be useful for traders who want to enter the market at the earliest possible moment. However, it may also generate more false signals. On the other hand, a less sensitive setting will filter out minor fluctuations and provide more reliable but potentially fewer signals.
Compatibility with Other Indicators
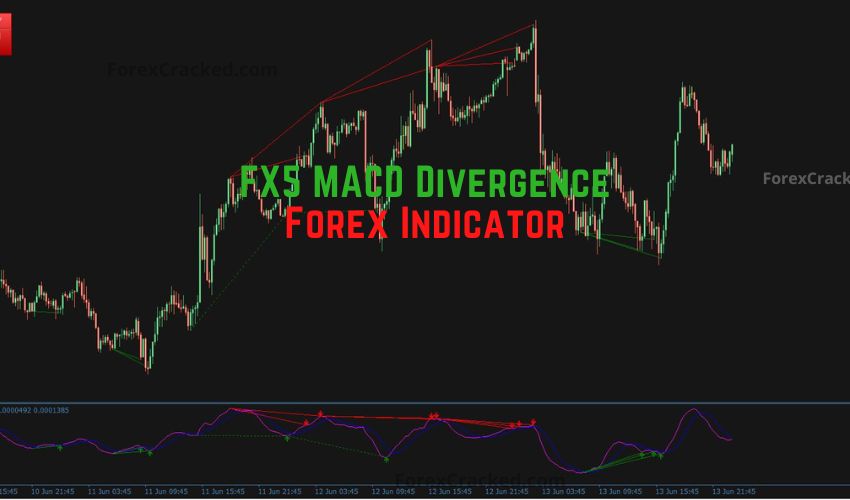
Another advantage of the BDFX indicator is its compatibility with other technical analysis tools. It can be used in conjunction with indicators such as the Relative Strength Index (RSI), which measures the strength of a price move, or the Moving Average Convergence Divergence (MACD), which helps identify changes in the strength, direction, and momentum of a trend.
By combining BDFX with other indicators, traders can get a more comprehensive view of the market. For example, if the BDFX indicator shows an uptrend, and the RSI indicates that the market is not overbought, it could be a strong signal to enter a long position.
Real – World Applications
In real – world trading scenarios, the BDFX indicator has proven to be effective. For currency traders, it can help identify trends in currency pairs. For instance, in the EUR/USD pair, if the BDFX indicator shows a series of blue bars over a few days, it might signal an upward trend in the euro against the US dollar. Traders can then use this information to enter long positions on the EUR/USD pair.
In the stock market, the BDFX indicator can also be used to analyze the price trends of individual stocks. A company’s stock price that is showing consistent blue bars on the BDFX – enabled chart might be a good candidate for investment, as it indicates an upward – trending price movement.
In conclusion, the BDFX indicator is a powerful tool for trend – following in financial markets. Its ability to clearly represent market trends, high level of customization, compatibility with other indicators, and proven effectiveness in real – world trading make it a must – have for traders looking to improve their trading strategies and increase their chances of success.