Developed by RBOT.CC
Dual-curve MT4 and MT5 subwindow indicator that records tick-by-tick maximum and average spread per bar, exposing 2x live-vs-demo broker spread spikes and hidden execution gaps with local CSV persistence.
TL;DR
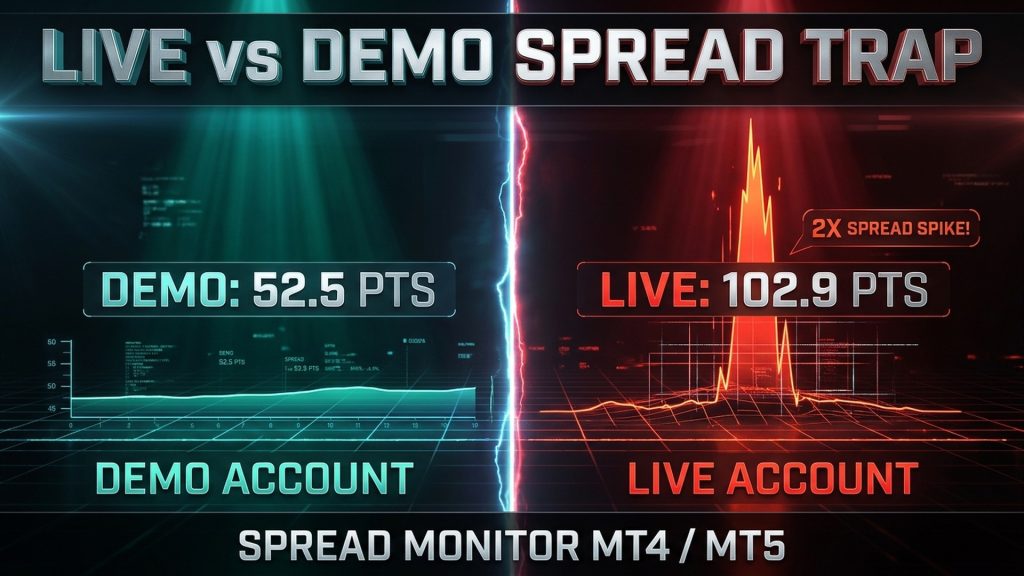
Side-by-side XAUUSD M1 verification proves why demo-tested scalpers fail live: while baseline spread sits at 10 points on both feeds, the Demo feed caps rollover spikes at 52.5 points whereas the Live feed surges to 102.9 points (nearly 2x higher) and fires extra off-peak spikes.
Developed by: RBOT.CC
Product specifications and updates are maintained by RBOT.CC.
Installation checked
This product is developed by RBOT.CC. No independently verified performance report has been published yet.
This product is developed by RBOT.CC. Performance claims require a public evidence report and do not promise future results.
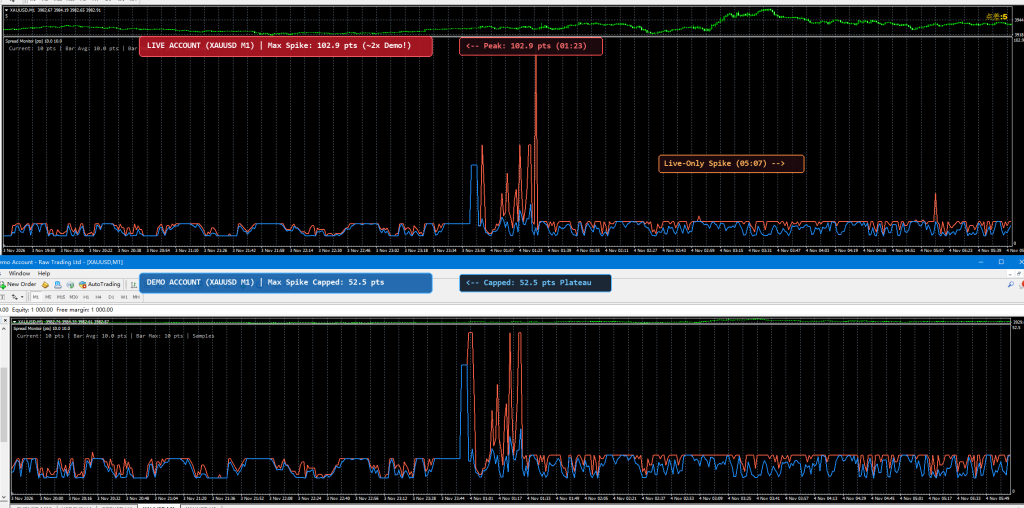
Standard MetaTrader charts only display the current instant bid-ask spread, leaving zero trace once a spike disappears. Even in MT5, the built-in bar spread array stores only the minimum spread of each bar, hiding the exact seconds a broker widens the book. Spread Monitor solves this by sampling every tick in real time: the blue curve plots the tick-weighted average spread to measure baseline cost, while the red curve locks onto the highest spread spike reached inside that bar. In our verified XAUUSD M1 comparison between a Live account (top) and a Demo account (bottom) from Nov 3 to Nov 4, both feeds look identical at 10 points for hours. Yet between 23:50 and 01:23 server time, the Demo feed artificially plateaus at 52.5 points while the Live feed surges to 102.9 points, followed by another isolated live-only spike at 05:07. On MT5, the indicator also calls CopyTicksRange on startup to backfill historical max and average spreads immediately, and both MT4 and MT5 versions save all recorded bar data to a local CSV file across terminal restarts.
Before trusting any scalper, grid, or night-session EA with real capital, run Spread Monitor simultaneously on your demo and live terminals on the M1 timeframe. A 2x spread expansion between demo and live, such as 102.9 points versus 52.5 points on XAUUSD, easily triggers premature stop-losses on sell positions or fills buy entries at unfavorable prices that never appear in demo testing or fixed-spread Strategy Tester runs. Having this visual curve and the exported CSV log gives you concrete evidence to calibrate your EA's max-spread filter, schedule a trading pause around rollover windows, or move your capital to a broker whose live liquidity matches its demo feed.
All Symbols (XAUUSD, EURUSD, Forex, Crypto) / M1-H1
To ensure smooth setup, we provide two installation methods:
⚡ Method 1: One-Click Auto-Installation (Recommended)
1. Extract the downloaded zip archive.
2. Double-click quick_install.bat.
3. Confirm your MT4/MT5 path (the script auto-detects it; press Enter). The script automatically deploys indicator (.ex4/.mq4) and template (.tpl) files to the correct folders, and launches your terminal.
🛠️ Method 2: Manual Installation
1. In MetaTrader, go to File > Open Data Folder.
2. Copy indicator files into MQL4/Indicators (or MQL5/Indicators), and copy any .tpl files into the templates folder.
3. In the Navigator panel, right-click and select Refresh.
For video demonstrations and troubleshooting, visit our step-by-step Installation Guide.
For the most accurate chart signals and reliable backtesting, we recommend IC Markets (Raw Spread). Key reasons based on its institutional infrastructure include:
• Institutional Liquidity & Tight Spreads: Raw spreads from 0.0 pips aggregated from 25+ top-tier liquidity providers, ensuring indicators (such as MACD, Moving Averages, and Oscillators) calculate true interbank pricing without artificial price spike distortions.
• Deep Tick History: Access comprehensive historical market data across Forex majors, Gold (XAUUSD), Indices, and Cryptos on MT4 and MT5.
• Zero Trading Restrictions: Full freedom to apply any technical strategy, scalping method, or custom indicator setup.
You can open a demo or live trading account via the IC Markets Official Portal to test indicators with real institutional feeds.
Yes. All core indicators and EAs on RBOT.CC are free to download directly without email walls, hidden paywalls, or account limits. If a third-party developer offers an optional commercial Pro version, it is clearly indicated with an external source link.
Yes. You can run them on unlimited demo and live accounts with any MetaTrader broker. We strongly recommend testing thoroughly on a demo account for at least 2 to 4 weeks to observe trade behavior and drawdowns before using real money.
For technical indicators and manual chart analysis, a standard home PC or laptop is completely sufficient.
For automated trading EAs running 24/5 uninterrupted, deploying on a high-speed Windows VPS is strongly recommended to eliminate trade disruptions from home internet drops or power outages.
We recommend HHOST Cloud Servers (Tier 3+ Data Centers in Hong Kong, Japan, and Singapore):
• Operating System: Choose Windows (available on the Standard $10/mo plan and above).
• Hardware Specs: 2 vCPU cores, 4 GB RAM, 40 GB SSD, and 100 Mbps bandwidth provide optimal performance for running multiple MetaTrader terminals simultaneously.
• Low Latency & High Uptime: High-capacity network route with 99.95% availability and sub-20ms latency to regional brokers.
You can configure and launch your server via the HHOST Windows Server Portal.
You can join our Telegram community (@wwwrbotcc) to ask setup questions, share backtests, and discuss strategy settings with the RBOT team and other algorithmic traders.
⚠ READ BEFORE USE
This indicator is for educational and expert use only. Test on a DEMO account for at least 30 days before going live. By clicking “OK”, you acknowledge and accept the risks of trading.